Introduction
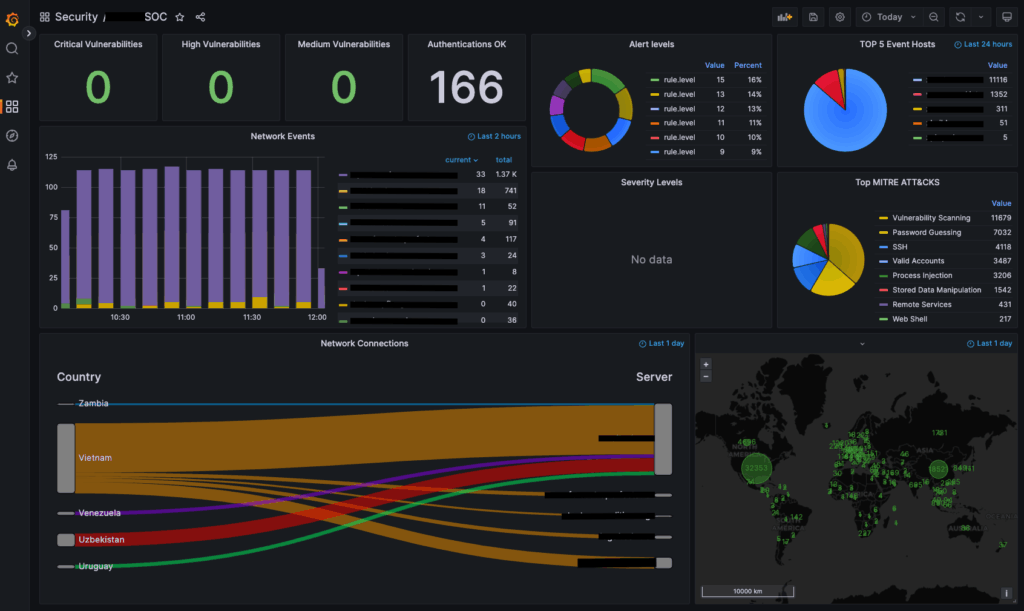
In today’s cybersecurity landscape, visibility is everything. As part of a SOC enhancement initiative, we designed and implemented a custom Grafana dashboard integrated with Wazuh, providing real-time insight into threats, authentication anomalies, and network behavior – all mapped to industry standards like MITRE ATT&CK.
This solution has drastically improved the threat detection and response capabilities for the security operations team.
The Challenge
- Existing SIEM and dashboards lacked actionable, visual context
- Security teams had difficulty correlating vulnerabilities, authentication attempts, and threat origin
- Need for real-time, multi-dimensional analysis of alerts and system behavior
- Desire to align security insights with MITRE ATT&CK framework
- Lack of geospatial intelligence on source and target network activity
The Solution
We designed a modular, data-rich Grafana dashboard built on top of Wazuh’s Elastic stack data, tailored for SOC use:
🧠Key Dashboard Components
- 🔐 Vulnerability Monitoring: Real-time count and classification of critical, high, and medium CVEs affecting monitored assets, with drill-down into CVE details.
- 📊 Authentication Metrics: Visual tracking of successful and failed login attempts, with anomaly detection (e.g., brute force patterns, logins from unknown sources).
- 🌐 Network Event Analysis: Displays volume and severity of network events, including IDS/IPS triggers, alert levels, and traffic breakdown by protocol.
- 🧩 MITRE ATT&CK Mapping: Classification of alerts into MITRE ATT&CK tactics such as:
- Initial Access (e.g., SSH brute force, phishing)
- Execution & Lateral Movement
- Discovery & Reconnaissance
- 🗺️ Geospatial Threat Mapping: Real-time world map of incoming threats by source IP and country – enhanced with reverse DNS and ASN lookup.
- 🔁 Sankey Flow Analysis: Dynamic flow diagram showing relationships between:
- Source countries
- Entry points
- Internal services under attack
Results
- Enhanced visibility into live and historical threats across multiple dimensions
- Faster response times from SOC analysts using actionable visual insights
- Increased situational awareness of attack origins and target trends
- SOC team now proactively monitors and classifies incidents based on behavior and intent, not just signatures
Conclusion
Integrating Wazuh security data into a tailored Grafana dashboard empowered the SOC team to move from log aggregation to threat-driven security analytics. The system provides a real-time, contextualized view of the organization’s threat landscape — aligning perfectly with industry frameworks and detection strategies.
This project is a proof of how open-source solutions like Wazuh and Grafana, when combined with the right expertise, can rival enterprise SIEM tools in both visibility and operational value.
📷 Preview Dashboard